
Are we in the great melt-up?
The market no longer makes sense

Markets can sometimes be disconnected from reality, but boy, what we are looking at right now makes absolutely no sense to a rational observer. We are:
Staring down unresolved conflicts in the Middle East
Gas prices are creeping back toward record highs
The average American is feeling the silent tax of inflation every time they step into a grocery store
And yet… The S&P 500 continues to march higher, totally indifferent to the reality of the world around it. One veteran analyst, Peter Grandich, says that we have entered the parabolic melt-up phase:


But as Grandich warns, this is the exit phase, not the enter phase. In his words, “It’s better to be a year too early, than a day too late.” So should you be worried? And if so, what’s the right course of action?
Today, I want to do two things:
Look at what the data is actually telling us
Look back at the worst financial disasters in history, and determine if this “Great Melt-up” shares any similarities with them
Then we can figure out the best course of action.
But before we get into it, subscribe to get these timely updates about the market in your inbox every week. Join 40,000+ investors here:
A different time, and a different place
To understand where we are going, we have to look at where we have been. Right now, a lot of people are overlaying the chart of the S&P 500 today with the 1920s stock market, and they look eerily similar. The 1920s were a period of booming activity. Banks just could not give out money fast enough, to people who wanted to invest it in the next great scheme. And that time ended in the Great Depression.
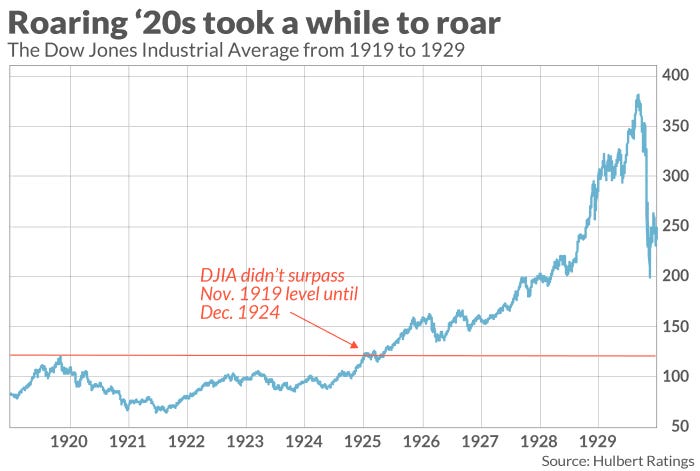
The thing is, 100 years later this looks eerily similar to the chart of the stock market right now. The patterns of exponential, unchecked growth are nearly identical.
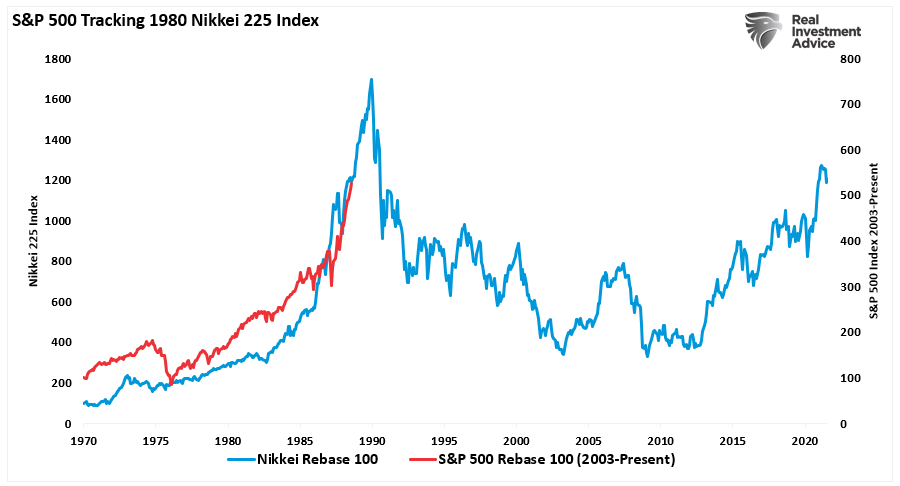
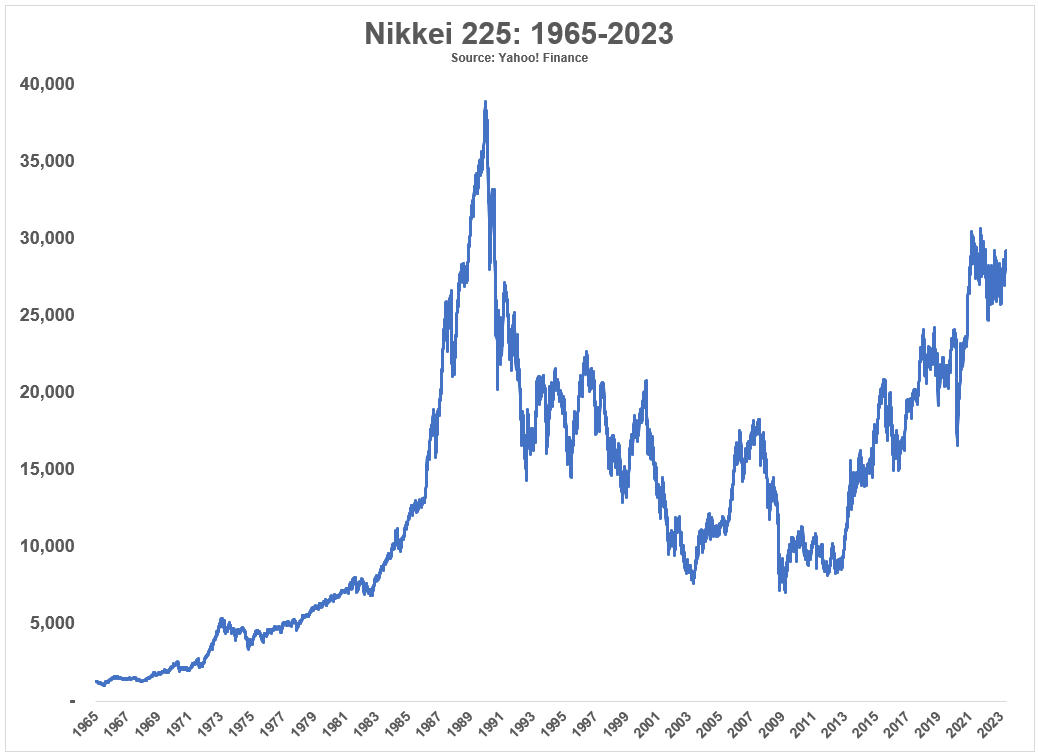
But the scarier comparison might not be another time, but rather, another place: Japan in the 1980s. From 1970 to 1989, the Japanese stock market increased by more than 22% per year. It was known as the Everything Bubble.

It was a simple mechanism.
Low interest rates flooded the economy with cheap money .
This allowed companies to speculate on stocks, driving stock prices up.
The increased corporate valuations allowed companies to borrow more money, to buy more stocks and real estate…
Which drove stock prices up further.
At one point, the cycle was so unsustainable that the grounds of the Imperial Palace were worth more than the entire state of California! This circular machine worked perfectly – until it didn’t. In 1989, the market crashed by 50% in just one year and went on to lose even more over the next decade. Japan’s market did not fully recover for nearly 40 years.
Today, the S&P 500 is tracking that same path with frightening precision.
The valuations of stocks and real estate are not something you can control, but you can control your value in the market by focusing on this year’s most important commodity: Skills.
If you spend any time on the Internet at all, you must have heard about Claude. It is one of the most talked about tools on the internet right now, and I have dabbled with it myself. The tool offers incredible possibilities, and new models and features like Claude Cowork, Claude Design, Skills, and Connectors are launching literally every week.
But maybe you are wondering where to start, and I get it, it can be a bit overwhelming. Which is why you need to join the World’s first Claude-a-thon hosted by Outskill.
It is a 2-day deep dive into Claude, its use-cases, and 10+ other AI tools. It’s this weekend from 10 am-7 pm EST — and they have just 1000 free seats for a limited time.

In the workshop, you will do deep research on Claude and use it to:
Build your own artifacts and dashboards.
Create full presentations.
Set up Claude Connectors like Indeed to automate your job search or client acquisition.
And much more. (Free for the next 48 hours)
The warning metrics
As if that wasn’t enough, we have more warning bells that are ringing:
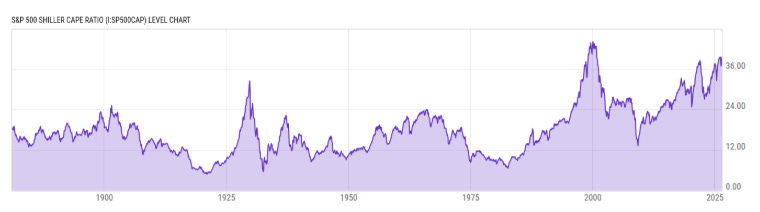
The Shiller CAPE Ratio has hit 41.05 as of May 2026. This is a measure of price relative to 10-year inflation-adjusted earnings, and a rough indicator of how overvalued the market is. This is the second-highest level in 155 years, exceeded only by the peak of the Dotcom bubble. For context, the historical average is around 17.

Source: YCharts The Buffett indicator is at a staggering 229%. This ratio compares the total U.S. stock market capitalization to GDP, and Warren Buffett said that anything above 200% is playing with fire. Berkshire Hathaway is following Buffett’s caution even though he has stepped down from managing it – it ended Q1 2026 with a record $397.4 billion in cash and treasuries, and from the audience, Buffett said, “We’ve never had people in a more gambling mood than now.”
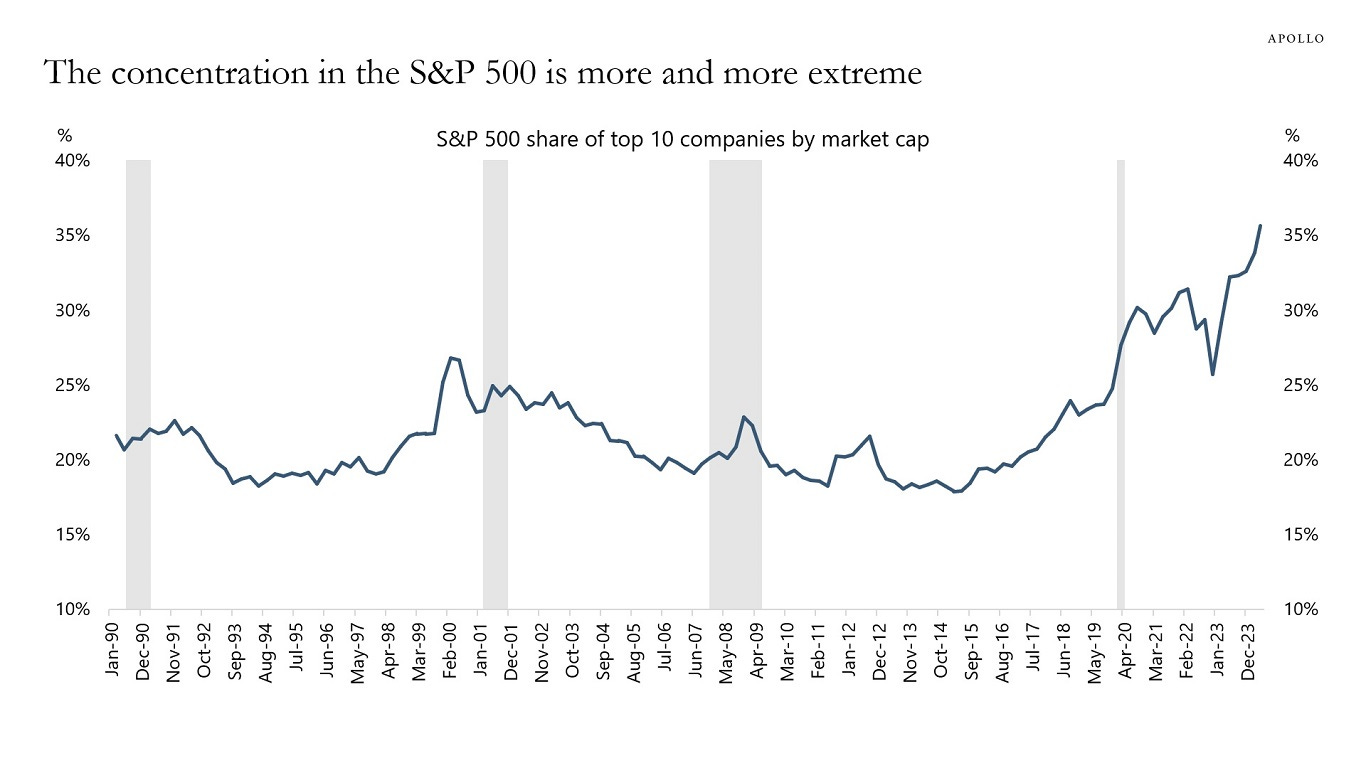
The top 10 stocks now make up roughly 40% of the S&P 500! This level of concentration is higher than what we saw during the Dotcom peak in 2001. If the Magnificent 7 sneeze, the whole market will catch a cold.
The deeper concern is a phenomenon that economists call Japanization. This isn’t about stock prices but instead, a decay in the engine that powers developed economies.
Japan’s major problem is demographic decline. The U.S birth rate is following the same trend – at 1.6 births per woman, we are well below the replacement rate of 2.1. Fewer workers are paying for systems like Social Security as the programs continue to get more expensive. So is it all doom and gloom?
The Counter-Argument: Why This Time Could Be Different
Now, let us play devil’s advocate. As much as the charts look convincing, there are fundamental differences between 2026 and 1929.
Real Earnings vs Hype: In the 2001 Dotcom bubble, companies with zero revenue were being valued at billions of dollars. Today, the companies driving the market like Alphabet, Amazon, Nvidia, Apple, etc. are generating huge cash flows. Roughly 78% of S&P 500 companies beat earnings estimates in the most recent quarter, and net profits are exceeding their 5-year average. In 2001, the average P/E ratio was 65. Today it’s just 28.
The AI productivity multiplier: Fidelity argues that we are in the early stages of a massive AI expansion. This growth is fueled by productivity gains rather than cheap debt, and companies in healthcare, industrials, and utilities are using AI to scale without increasing headcount.
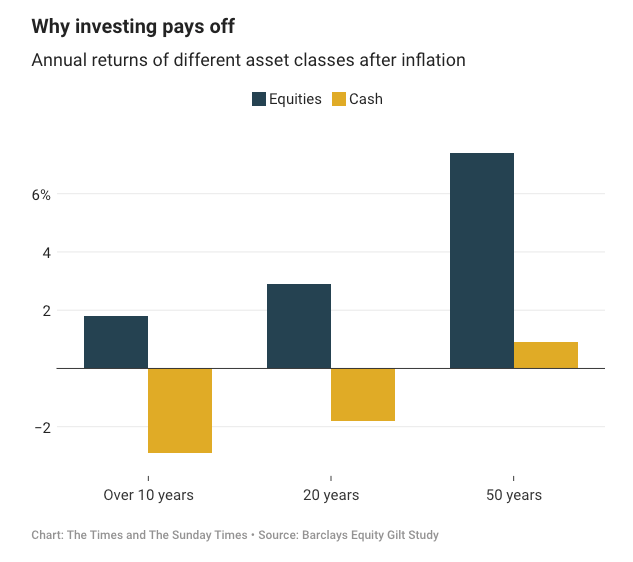
The cost of cash trap: Let’s say all the fear is justified. Still, people do have the question, “If I don’t invest in the market, where do I put the money?” Over the last 20 years, holding cash has resulted in a 1.8% annual loss in purchasing power. You’re essentially choosing between a guaranteed long-term loss in cash, or a potential short-term loss in stocks. The FOMO is actually a rational response to dollars declining in value.
So what do you do in a situation like this? I am a huge fan of the phrase:
The market can remain irrational longer than you can remain solvent.
Isaac Newton was one of the smartest people who ever lived. During the South Sea Bubble of 1720, he invested early and made a fortune. He cashed out, thinking the market was a bubble. But then he watched his friends get even richer as the market doubled again. He could not help himself: he jumped back in near the peak and lost his entire life savings.
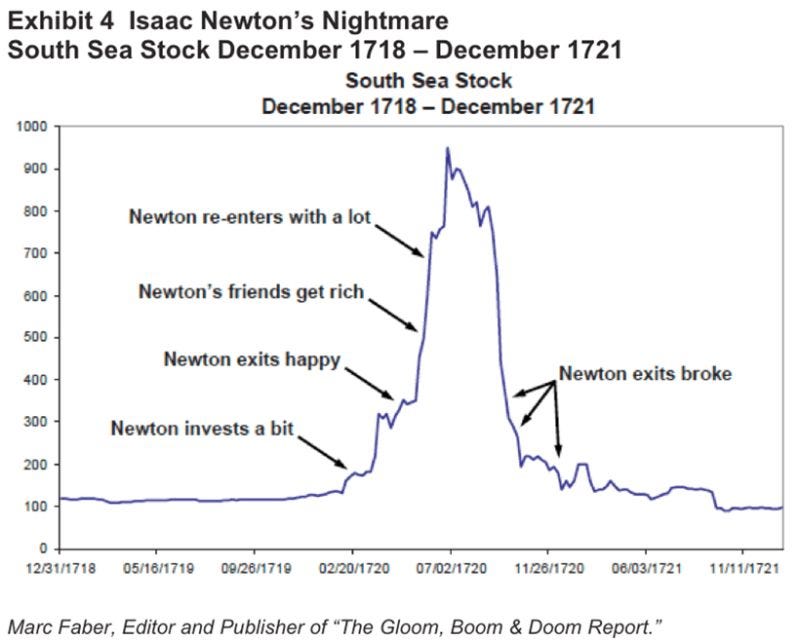
The lesson here is not that he should have timed the market or stayed out of it – it’s that he invested emotionally despite being a man of logic, and didn’t stick to his own plan. And that isn’t surprising. It’s the norm. But the people who can buy and hold, not being bucked by their emotions do surprisingly well.
If you had invested at the absolute peak of the 1929 market – the literal worst day in history – and did absolutely nothing for 20 years, you still would have earned an 11% profit from dividends alone. And that assumes you did not buy a single dip during those two decades.
That’s why I’m sticking to my barbell approach:
Diversification: I am spread between U.S. and International Index Funds.
The Cash Buffer: I maintain roughly 20% in tax-free municipal bonds and high-yield cash. This is not because I am predicting a crash but to have the mental and financial capacity to buy more if a crash happens.
DCA is King: I know people joke about me saying just DCA into low-cost index funds, but the people who have done that for the nine years I have been talking about them have done incredibly well!
The stock market’s job is to make you say, “This makes no sense.” Do not fight the market. Just make sure you are diversified enough to survive it.
If you enjoyed this, hit that like button, restack this post, and share it with a friend who is worried about the market. It really helps out the newsletter.
See you next week!
— Graham
Always great finding resonance with authors of my view. It is also highly important to consider where you are in life and manage risk. Those in, or close to, retirement need to be wise here.
Great post. Thanks for sharing!