

How do you grow without the overhead? With Upwork.
Hire top freelance talent in:
AI
Marketing
Web & App Development
Design
Finance
…and thousands of other skills

Why Upwork works for smart founders:
✔ Hire in hours, not weeks
✔ No salaries or long-term contracts
✔ Pay only for approved work
✔ Access a global network of experts
Build faster. Spend smarter. Stay in control.
Nobody knows what a bubble looks like. It’s like a locust invasion that just sweeps through a field leaving destruction in its wake, and you only know about it after its gone. But… there will be warning signs.
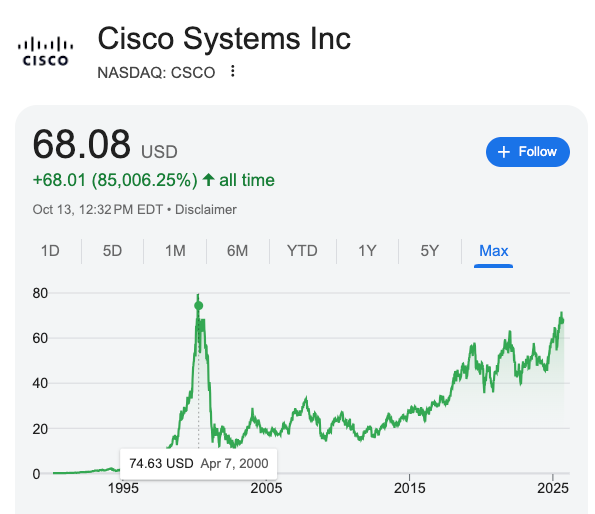
Take the 1990s for example. Speculation around internet companies was driving everyone wild. The logic was simple: The internet was the future, so every company with a “dot com” in its name had to be a winner. Except, people started putting “dot com” in the names of their companies even when the company had nothing to do with the internet. Valuations soared to unsightly levels. Investors poured billions into unprofitable companies. Cisco was the poster child of this scene.
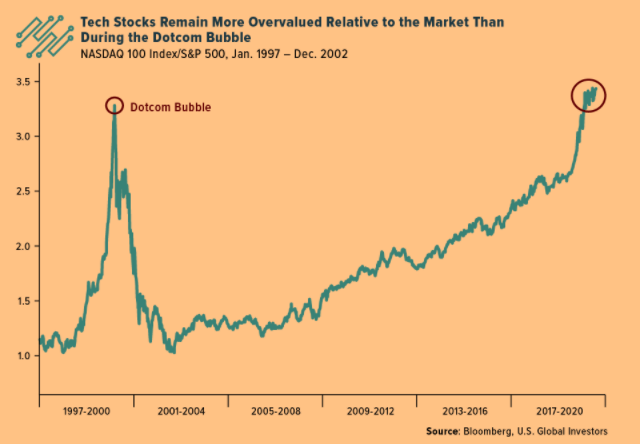
Today, the Nasdaq is trading at 35 times earnings.
In 2001, the Nasdaq’s price-to-earnings ratio was 75x.
But Cisco traded at 472x earnings! People thought it was too big to fail.
When the bubble burst, tech stocks fell by an average of 78% and took nearly two decades to recover. 25 year later, Cisco has never returned to its peak of 2000.
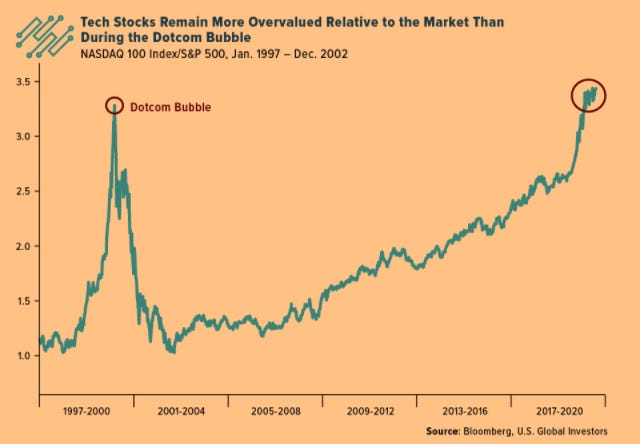
The current numbers are an eerie reminder of what happens when the numbers don’t match with the reality. Now the same thing might be happening all over – except with AI instead of dot com. Searches for “AI Bubble” are at a record high. The CAPE ratio is now at its highest point since 2000. Investors are again pouring money into companies that show little or no profit. An MIT study even found that 95 percent of firms using AI reported no measurable return on investment.
This time the bubble could be seventeen times larger than 2001 and four times bigger than the 2008 crisis. Investor Paul Tudor Jones says that the ingredients are in place for a massive market blow-off.
That’s why it’s time to look closely at what’s happening – so that we know what to expect next, and why so many people could be facing a painful wake-up call which could put years of savings at the risk of disappearing in months. So let’s break down the facts behind the rise, the risks that come with it, and the best way to think about the months ahead:
Infinite money glitch
What sort of greenhouse does a market bubble grow in? Enthusiasm, excitement, and money all need to collide at once to push prices far beyond reality. Now we’re seeing one such extreme time:
OpenAI recently raised funding at a five hundred billion dollar valuation.
Then OpenAI committed three hundred billion dollars for Oracle Cloud Compute, causing Oracle stock to jump.
Oracle runs on Nvidia chips – so Nvidia demand exploded.
Nvidia invested one hundred billion dollars back into OpenAI.
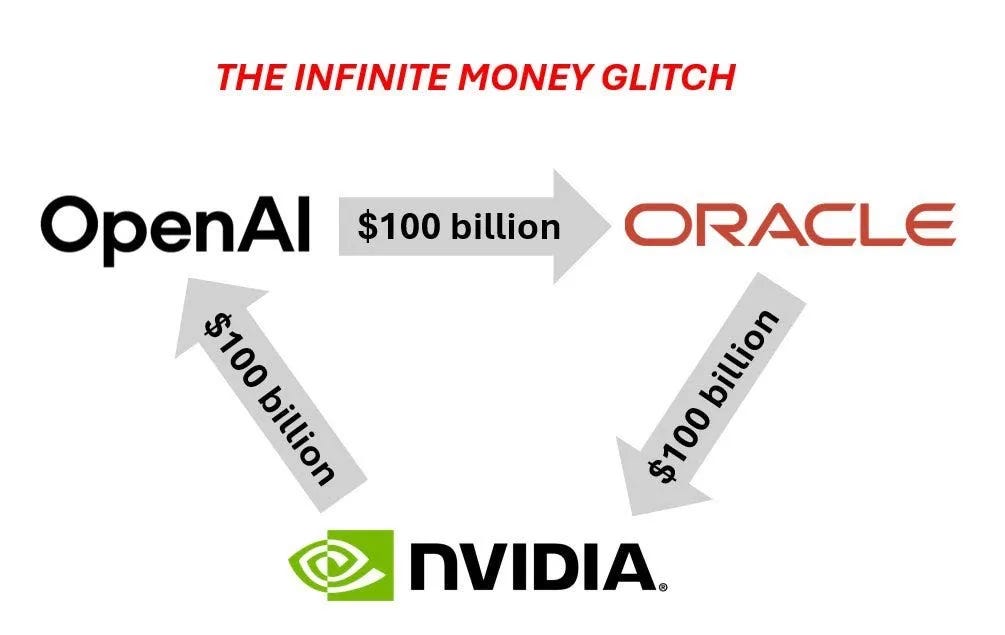
If you thought that was strange, it gets even stranger. OpenAI owns ten percent of AMD. Intel is partnering with AMD as a customer. The government owns ten percent of Intel. In simple terms, imagine Paul investing one hundred dollars in John, who invests one hundred in Bob, who invests one hundred back in Paul. Each of them shows a gain on paper, but the entire system is still built on the same original hundred dollars. This is leading to some cracks in the market…
The warning signs
1. Price-to-earnings ratio
As of this week, tech makes up a larger share of the S&P 500 than it did at the peak of the 2001 Dot-com bubble. Nvidia, the world’s most heavily weighted stock, trades at a price-to-earnings ratio of 57. That means investors are paying fifty-seven times what the company earns, assuming future profits will justify it.
2. Buffett Indicator
Then there is the Buffett Indicator, which compares the total value of the U.S. stock market to GDP. Warren Buffett once called it “the best single measure of where valuations stand at any given moment.” A reading of one hundred percent is considered fair value. At seventy percent, stocks are a bargain. Near two hundred percent, investors are playing with fire.
Today, that indicator sits at 217 percent, the highest level ever recorded.
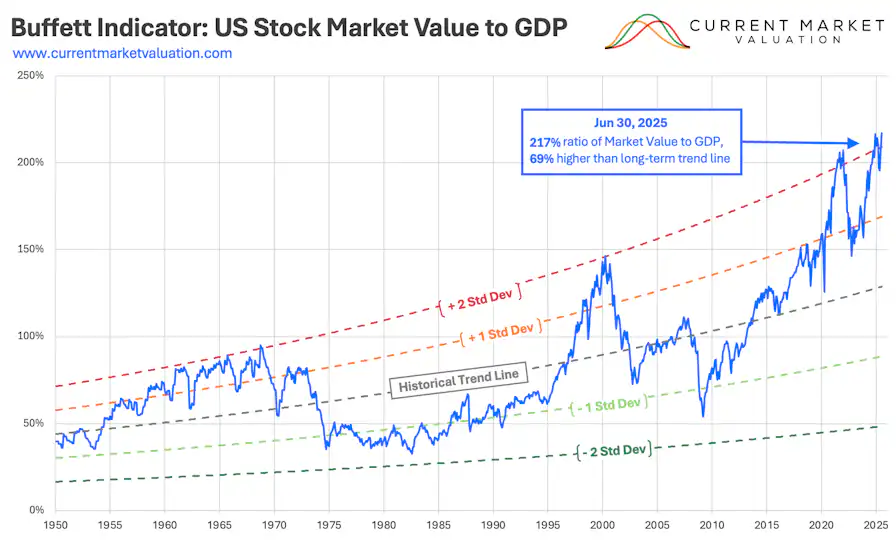
To be fair, critics argue the metric is outdated because interest rates affect valuations differently today. But it hasn’t stopped analysts from sounding alarms.
3. Market Concentration
Across the S&P 500, the top ten companies now account for more than forty percent of the index. So even if you think you’re diversified through an index fund, nearly half your money rides on fewer than a dozen stocks.
Are we in a stock market bubble?
By almost every measurable indicator, markets are trading at historically high levels:
60% of venture capital now flows into AI, compared to 40% into the internet during the 1990s.
Price-to-sales ratios are back at heights not seen in decades.
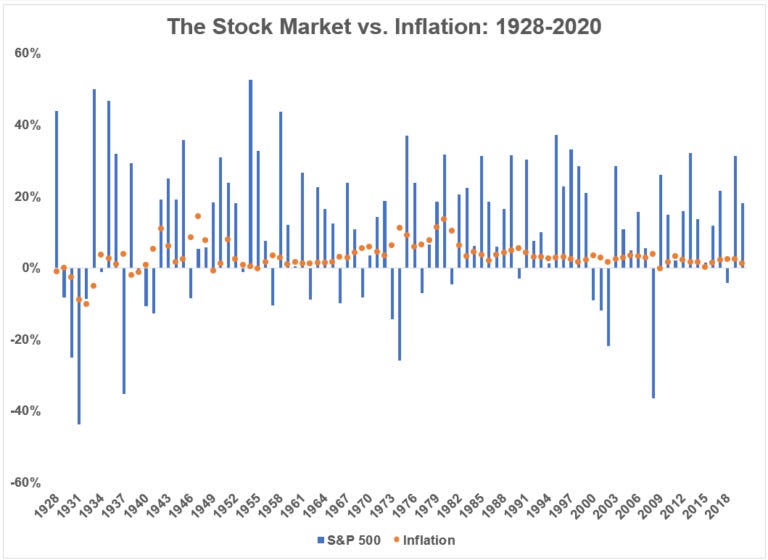
Some say this is because the dollar is weak. But the data shows no consistent link. Over the past fifty years, the dollar’s value has risen and fallen through multiple market cycles without driving stock performance in a clear direction.
Fisher Investments analyzed this further and found that the correlation between the dollar and the S&P 500 is only –0.15, essentially zero. Stocks have risen roughly 76 percent of the time, whether the dollar was strong or weak.
Inflation has also shown little correlation with long-term returns. As analyst Ben Carlson notes, “The stock market is forward-looking, and inflation is backward-looking.” The data suggests that the market’s expansion is not purely a result of money printing. But that does not rule out the possibility of a bubble forming.
But there’s counter-evidence that the market is not yet in a bubble as well:
Remember the Japanese stock market bubble of the 80s? If the S&P 500 followed Japan’s path, it would trade around 11,000. It currently sits at roughly half that, with about $7.7 trillion in cash still waiting to enter the market.
AI stocks are backed by profitable companies like Microsoft and Google, not fragile startups like those in 2001’s tech bubble. The technology could justify its valuations over time, much like Amazon after the Dot-com bust.
The fact that everyone is already worried about a bubble means some of that fear is likely priced in.
Still, caution is smart. Keep your income steady, stay diversified, and maintain a long time horizon. If the market drops, you can buy cheaper. If it rises, you remain invested.
What I’m doing now
I like the quote “The market can remain irrational longer than you can remain solvent.” It reminds me not to assume I can outsmart the market. Even brilliant people have fallen for bubbles, like I told Newton’s story in an older post:

But some people have tried anticipating bubbles correctly and still failed. You might have watched the movie “The Big Short.” Michael Burry became famous for predicting the housing market crash and taking a short position against him which made him and his investors a ton of money. But till his bet paid off, he had to pay premiums on the short position (kind of like how you would pay premiums on an insurance policy). If he had run out of money to pay the premiums before the market crashed, his fund would have gone bankrupt even though he was eventually right. Being smart cuts both ways.
That’s why, I don’t try to predict the market. Instead, I try to find an approach that is most likely to work regardless of what the market does. I dollar-cost average into the market on a set schedule. I spread my money across U.S. stocks, international stocks, emerging markets, and a Bitcoin ETF. I also hold municipal bonds earning 3.5 to 4.5 percent, tax free.
This keeps me invested while still giving me options. If markets fall, I can buy cheaper. If they rise, I still benefit. Holding cash on the sidelines carries an opportunity cost, but it also acts as insurance when volatility hits.
Every metric right now says the market is expensive and expanding beyond fundamentals, but that does not mean it will not keep rising. Planning for a crash and waiting on the sidelines has historically cost investors more than staying invested.
Or maybe I am wrong. I am just a guy writing posts on the internet. Let me know what you think in the comments, whether you see this as a warning sign or another leg higher. I will do my best to read and reply to as many as I can.
Thanks so much for reading, and until next time. If you read this far, please like the post and share it with one other person – it helps the newsletter grow!
I was not aware of the Buffett indicator - thanks for teaching me something new!