

Sticking to the course
Sticking to the course
The Fed is getting a hold of inflation

What’s up Graham, it’s guys here :-) If it’s your first time here, hit the subscribe button below to join 39,400+ smart investors and never miss an update on the market again. It only takes a second.
The Federal Reserve is probably the most important financial institution in the world. Every move that the Fed makes has a global impact. Trade is now globalized and interconnected, and any change in US monetary policy can shake up fragile countries. Short-term political incentives should not direct power of this kind – and though there is occasional criticism that the government influences the Fed in power, it’s a reasonably independent institution.
But there was a time when politics dictated Fed policy. In the 70s, the US underwent massive economic changes – President Nixon took the US off the Gold Standard, the US was reeling from the oil shock, and we saw double-digit inflation for the first time ever. During this entire time, Arthur Burns was the chairman of the Federal Reserve. Burns was an accomplished man, but at a time when inflation was getting out of hand, his methods were heavily criticized:
He stuck to the theory that the unemployment rate must be maintained at 4% at any cost, and pushed for an accommodative monetary policy. This was probably due to political pressure.
He did not start raising interest rates at the beginning in response to inflation, and the situation got progressively worse.
His communication was inconsistent. He would oscillate between stimulating economic growth and controlling inflation, and his guidance on interest rates was ambiguous. Market participants struggled to predict what the future would hold.
When he was removed from office, his successor William Miller also faced similar problems. The faith of the public in the institution of the Federal Reserve was eroding. It was only when Paul Volcker entered office that there was a turnaround. Volcker’s measures were radically different from Burns’ – Inflation was already in the double digits, and he started hiking the Fed interest rate rapidly to bring prices under control. Initially, this sent the economy into shock. But the difference was that Volcker was consistent about his mandate, said what he was going to do, and stuck with it. Though it was a bitter pill, the market could see what he was doing, and as time progressed, his plan worked. Eventually, the economy returned to “normal”.
The Burns-Volcker story is a case study of how not to respond to inflation, and how to repair it, respectively. It was a lesson for future policymakers – not just in setting interest rates, but in charting a plan and sticking to it. In fact, when history was poised to repeat, Volcker’s playbook is what the current Fed turned to for guidance. It seems to be working. After a period of rapid rate hikes, we are finally beginning to near the end.
For the first time in 14 months, the Fed has announced a pause in rate hikes. How have they done so far? What does this mean for the markets? Read on to find out.
The plan
On 16 March 2022, the Fed announced its first rate hike of 0.25%, bringing an end to the era of free money that we had enjoyed for the last ten years. Their plan was to fight inflation and bring prices under control, and they used a term that’s every investor’s nightmare: Quantitative tightening.
Though the Fed is a giant institution, it really has only a few tools at its disposal: Buying and selling debt, or raising and slashing interest rates. Throughout 2020 and 2021, the economy had been at risk of slowing to a halt due to the Covid pandemic. Companies that needed capital to run their businesses weren’t finding institutional investors to sell loans to because the risk of lending was higher than just holding cash and waiting on the sidelines. The Fed had intervened by promising to buy an endless amount of Corporate Bonds and Mortgage Backed Securities. This was an emergency measure to stimulate lending throughout the economy.
The move worked and boosted the confidence in the economy. With the market rising and stimulus checks providing free money, a lot of money poured into the market boosting stock prices to all-time highs. But obviously, the Fed’s job isn’t to play roulette on Wall Street, so they eventually had to sell – this is what “quantitative tightening” meant. This would just mean that the Fed would get back its loans with interest, and they wouldn’t reinvest the proceeds.
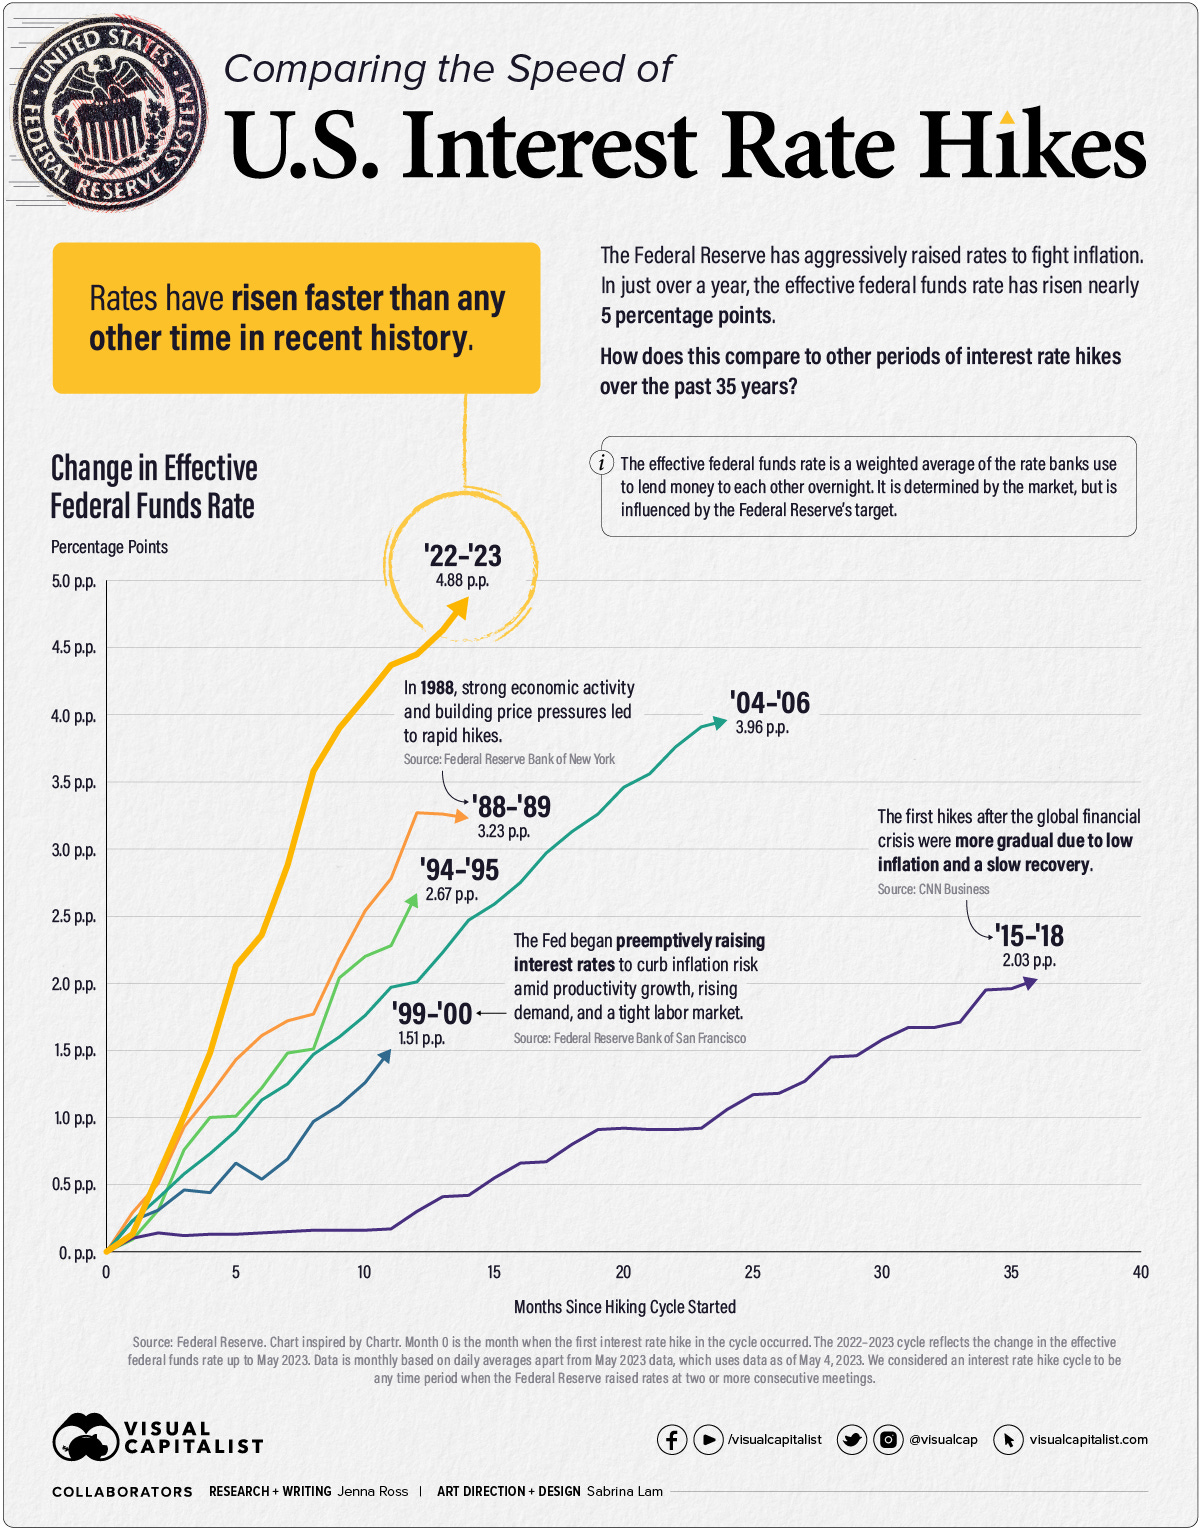
As a result, yields increased, asset values fell, and interest rates skyrocketed faster than at any other point in history. But after four 75 basis point rate hikes in 2022, two 50 basis point rate hikes, and four 25 basis point rate hikes, the Fed finally seems to be slowing down. So it’s time for us to assess: How is everything doing?
Inflation report
When the Fed started on its plan last year, there were opinions that it was too little, too late. Surprisingly, things are doing much better than expected. According to the latest inflation report, inflation is at 4% in May, which is the lowest YoY number in two years. Month over month, there’s been an increase of just 0.1%.
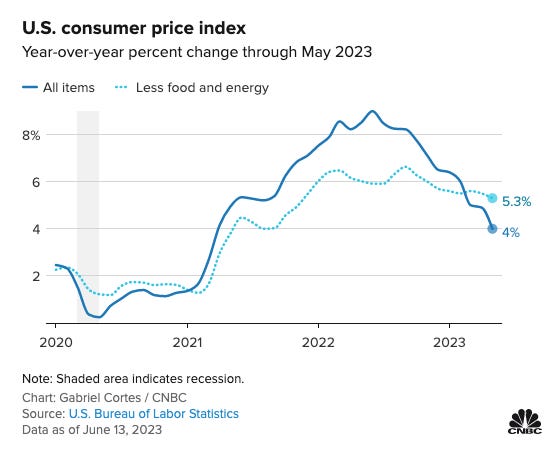
The fight against higher prices seems to be working, except that there are some issues with the report. Core inflation, which measures inflation excluding food and energy prices, is stickier than expected.
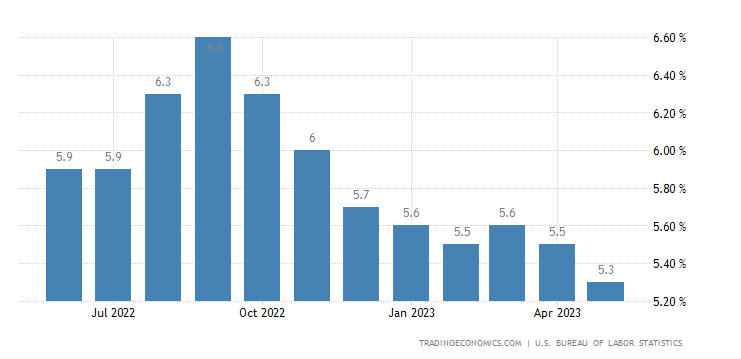
It increased 0.4% MoM, and 5.3% YoY, and the figure has hovered around this range for a long time. Since these price rises are systemic in nature (driven mainly by shelter costs), the chances of them coming down any time soon are slim. But it’s still a slight improvement compared to the figure last month when the YoY inflation was around 5.5%. And the markets seem to be loving it…
The stock market reacts
At first glance, the market seems to be doing great: The S&P 500 is up more than 12% year-to-date, more than 4% year-over-year. But once you start digging into the details, you find out that all is not well. It’s no secret that the S&P 500 is quite lopsided – It is made up of the 500 largest companies by market cap which satisfy certain criteria, after all. But in this case, even the majority of returns seem to be driven by a handful of companies while the median stock is down 0.2%.
Almost all of the index’s gains are really coming from just 5 companies – Apple, Microsoft, Google, Amazon, and Nvidia. If you remove these from the list, the market would be only up 1.5% after including dividends. If you removed the two other largest tech companies, Tesla and Meta, the S&P 500 would actually be down for the year, leaving most investors in the red.
Does this sound unusual? Historically speaking, it’s actually quite normal. Hendrik Bessembinder, a finance professor from Arizona State University analyzed 26,000 publicly traded stocks since 1926 – and he found that the average stock traded for only seven years and lost money, even including re-invested dividends!
And that’s not even the worst part – The most common return for an individual stock, over its lifetime is a loss of 100%. Only 48% of stocks delivered any positive returns at all. In addition to that, only 1000 of the 26,000 stocks accounted for all the stock market profits since 1926. Only 86 stocks were responsible for half of those gains.
From this data, throughout almost 100 years, only 4% of stocks actually made more money than the average return of one-month treasury bills, and the other 96% of those winning stocks just kept pace with inflation. There’s a caveat here: This data analyzed all stocks including penny stocks and random IPOs throughout the dot-com bubble, which might skew the data. When you look at the largest publicly traded stocks, 80% of them made money over 10-year periods – but 56% of them performed worse than the overall index. A handful of stocks have always been responsible for the majority of gains, and it’s impossible to predict which ones those will be.
What we’re seeing today is completely normal. Throughout history, the largest companies are constantly changing and leading the overall index toward profitability. For example, Axios mentioned that
A few years ago, it was ‘FAANG’ stocks which led the rally.
In the 1990s, it was the “four horsemen” of Microsoft, Cisco, Oracle, and Intel.
In the late 1960s and early 1970s, it was the “nifty fifty” that lifted the market.
The decision to index is not a random one – it’s precisely because it’s so difficult to pick the winners over a long period of time that it’s better to just diversify, sit back, and reap the gains. Despite all of that, the good news is – We’re officially in a bull market, fueled by the recent hype around AI.
But we’re not in the clear yet. If inflation doesn't slow down, the Fed will raise rates again. They’ve projected another 2.25% hike before the end of the year, bringing us to 5.6%. This was not priced in. It’s likely that we see another rate hike in July and another one in September, till it's clear that inflation is going down. The market reacted negatively within seconds of the report being announced. We should get more clarity in the coming months.
But what does this mean for housing prices?
Real estate
Redfin’s monthly report is the go-to if you want to understand the state of the overall housing market. In May, their findings were rather surprising.
On a national level, the mortgage rates near 7% had handcuffed homeowners, and as a result, they were refusing to list their houses for sale. Why sell your house and then buy another at a higher interest than you’ve already locked in? (For example, if someone has a 3% interest rate for 30 years, it makes no sense to sell and buy something else at a 7% interest rate – this would end up costing them 50% more).
New listings have hit their lowest level of any early June or record. This has limited home sales, reduced inventory on the market, and kept prices afloat at a time when there were fears of a housing crash. So, home prices are down nationally – but only by 1.6% year-over-year. The price changes across the country are not uniform:
Austin, Texas, Oakland, California, Las Vegas, San Francisco, and Phoenix are seeing the largest declines.
Cincinnati, Miami, Milwaukee, Fort Lauderdale, and Virginia Beach have increased by another 4 to 13%.
Realtor.com also seconds this, noting that “22.7% fewer new homes were listed for sale compared to last year.” They also found that “5% more people felt like now is a good time to sell compared to the previous month.” Higher mortgage rates aren’t deterring the buyers who are currently in the market, and that’s keeping prices relatively strong.
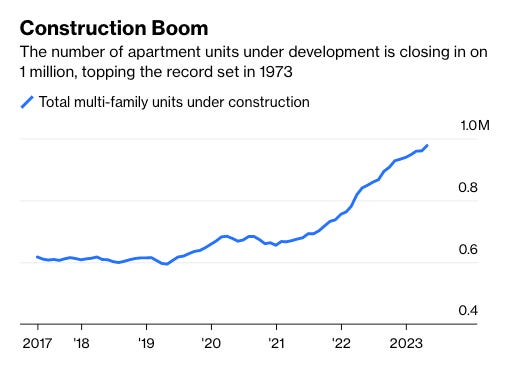
However, if you’re currently sitting on the sidelines waiting for prices to fall – there’s some good news, in the form of lower rent. More new units are coming on the market than at any other point since 1973 because of a recent construction boom. The homeowners who are holding off on selling their houses are also looking to rent, and all this combined means you could potentially save some money.
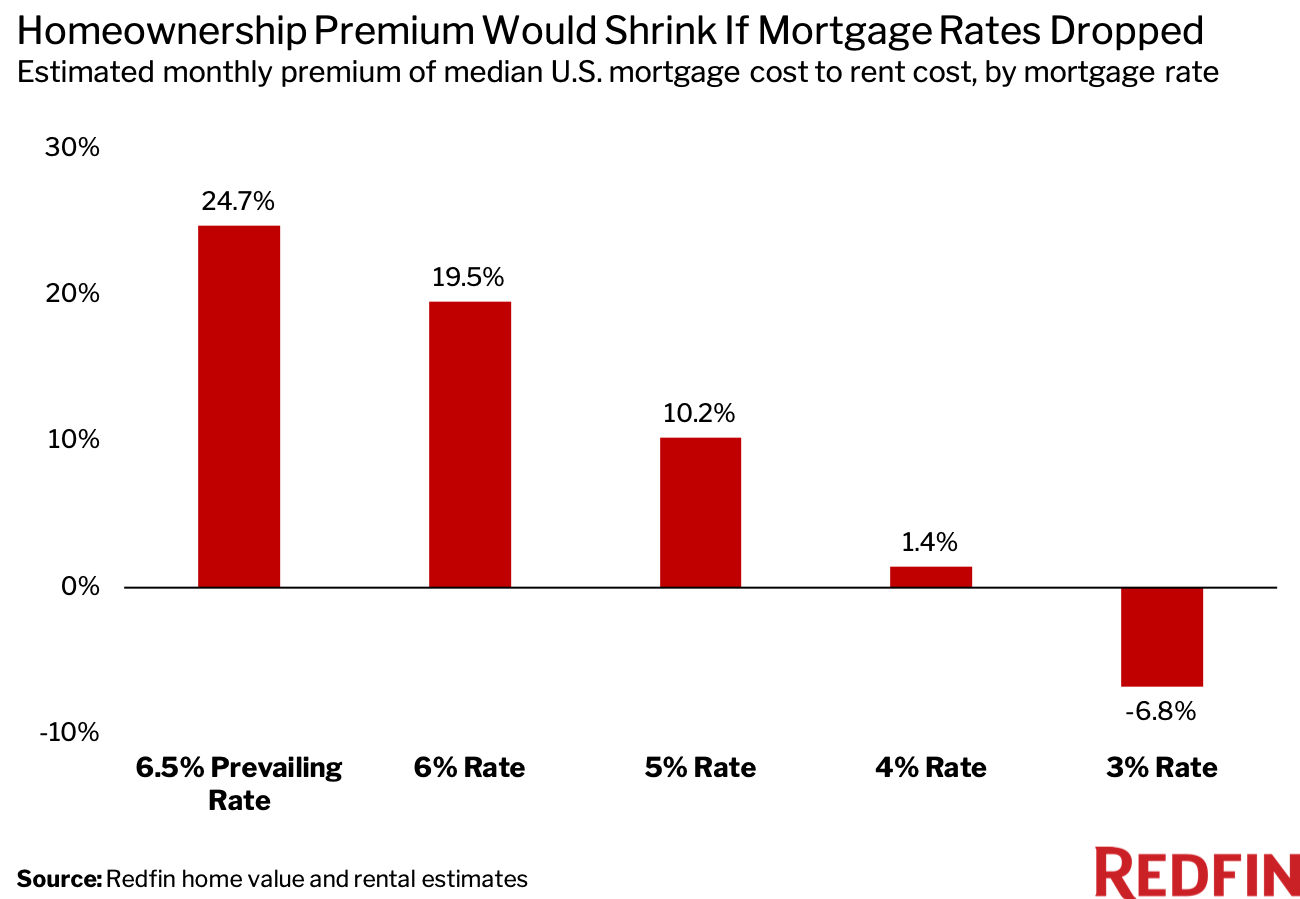
A recent Redfin study found that throughout the entire country, only four major metros are cheaper to buy than rent – Detroit, Philadelphia, Cleveland, and Houston. Outside of those locations, owning your home at a 6.5% interest rate could cost you as much as twice the amount you’d have to pay in rent. Buying in many cities probably doesn’t make financial sense in the short-term.
All this would change if mortgage rates fell – At 4%, the cost of renting would begin to level out. But until then, there’s a lot more inventory for rent than sale, and as a renter, you might as well use that to your advantage.
Now, here are my own thoughts on this. The Federal Reserve has surprisingly pulled off their plan by sticking to it and communicating clearly about it – and now they can tweak it based on a wait-and-watch strategy without sending the entire economy into a tailspin. They’ve actually done a decent job of bringing inflation under control – with the casualties being some failed banks and slightly higher jobless claims – but other than that, it does look like we’re heading towards the “soft landing” that seemed unachievable a year back.
So have we avoided a recession? It’s hard to say. The tightening of credit has resulted in a recession every time it has been tried since 1970. There have been exceptions in 1994-95 and 2015-18 – if the situation today turns out not to be a recession, it’s a bit of an anomaly, but it isn’t exactly impossible. All the indicators point otherwise. The New York Times notes that as of now, both unemployment and inflation are relatively stable, and that “the job market is so strong that even if we have a temporary rise in unemployment, it won’t create that much hardship.”
So till it all settles down, we’re likely to take a temporary rate hike pause, see what happens, adjust as needed, with the potential for more rate hikes in the future and then, hopefully, we can eventually return to normal. Or, I guess, whatever counts as normal these days.
Stay safe, stay invested, and I’ll see you next week – Graham Stephan.
If you liked this article, you can forward it to one person who might find it useful :)
Disclaimer: This is not financial advice. This information is intended to supplement your knowledge in the field of investing and personal finance. Please do your own research carefully.